K-Nearest Neighbors
Given dataset of datapoints (where ) and corresponding labels (where each ), we essentially memorize the dataset by storing it in an appropriate data structure. For simplicity we can assume that there are only 2 classes ( can be considered 1 and can be considered or ).
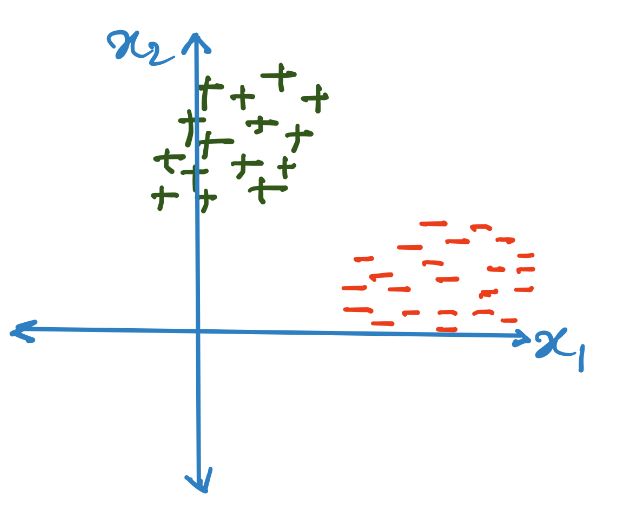
Say we are working with the dataset shown above. Non-parametric models have no learning phase. The entire dataset is stored within the model without modification. During the inference phase, the “memorized” datapoints are used to figure out the label for a new test datapoint. Let’s figure out strategies to perform inference using the dataset.
Recall that the goal of machine learning is not to perform well on the training data, but to recognize interesting patterns and perform well during inference on previously unseen datapoints (assuming these new datapoints are sampled from the same distribution as the training set, i.e. i.i.d. assumption). Since we know that the training datapoints have labels, one way to predict the labels of the new datapoint would be to find the “closest” datapoint in the training set and predict the output as the same label as that of the closest datapoint. The closeness can be compared using some distance metric as applicable. For instance Euclidean distance for dense embeddings and Manhattan distance for one/multiple-hot embeddings.
However, this might not be a very good idea in certain cases. Assume that there is some noise in the dataset (obtained while data collection due to defective sensors). Consequently, it might so happen that a linearly separable dataset might appear to be not linearly separable:
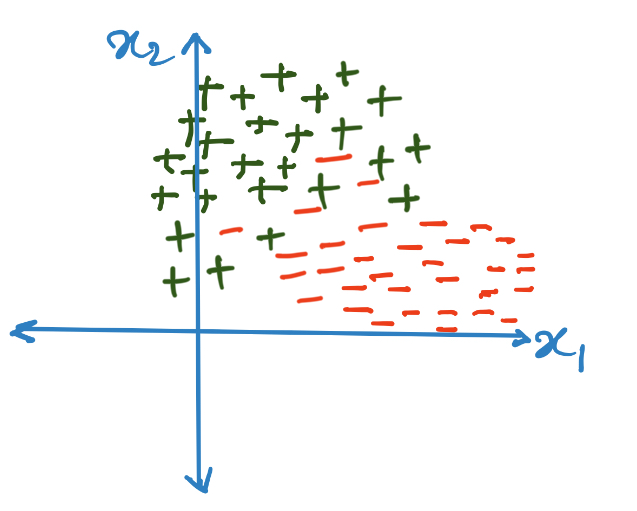
In such a case, we must introduce some bias into the model. A good bias might be to select the top closest datapoints in the training set and take the majority vote among them.
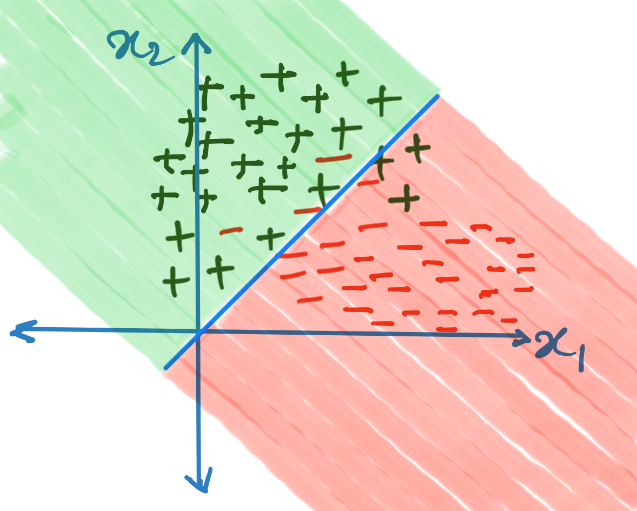
From the above images, one can see that without the majority vote, the decision boundary is very complicated, but the bias of taking a majority vote makes the decision boundary smoother.
Note:
- K-NN algorithms have an inference time complexity of for each new datapoint since to find the k-closest datapoints, the new datapoints must be compared to each datapoint in the training set.
- Additionally, the model size is also not fixed. Based on the training data availability, the model size will keep on changing. This is bad for situations where the model is desirable to be small, however in situations where the model needs to be updated frequently, this is good, since the entire model doesn’t need to be retrained from scratch as soon as new data is available.
- The same concepts can be extended to regression and multi-class classification. In the former case, all we need to do is take the mean value of the neighbors’ labels.
Parzen Windows
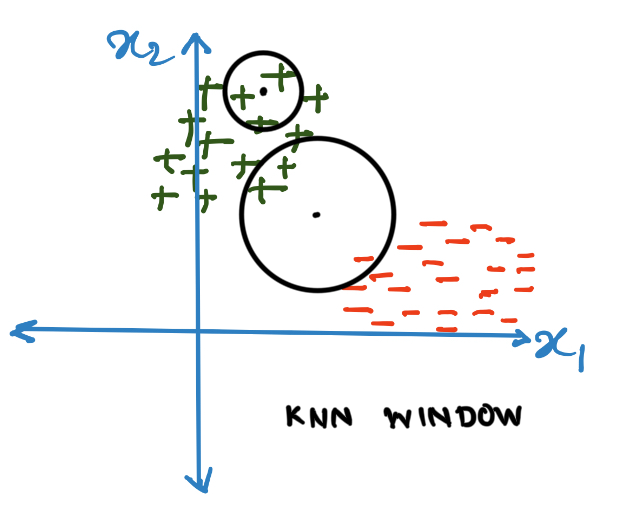
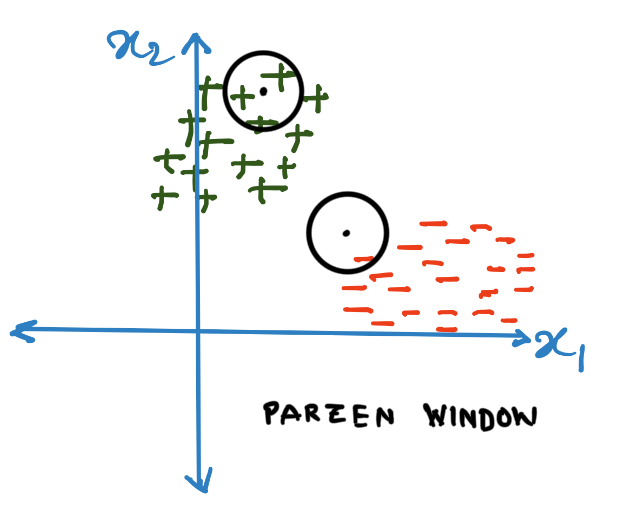
Notice (from the above images) that what k-Nearest Neighbor algorithm essentially does is that it figures out the appropriate length of the radius of a circle that can fit points within it where the new datapoint is at the center of the circle. Instead we can fix (according to some heuristics) a circle with fixed radius. We can take the majority vote of all the datapoints within the circle. Such a circle is known as a Parzen window.
Note that the window need not be circular, it’s only circular when the metric under consideration is Euclidean, for Manhattan distances it will be a square. We often call this window a kernel (more on kernels in SVMs).
We can additionally assume a density over the window. Since in kNN, we give equal weightage to each datapoint, we can assume that the underlying density is Uniform. However it might not be a good idea to give equal weightage to each datapoint within the window. Intuitively, it makes more sense when we give more weightage to datapoints that are nearer to the new datapoint. So, one way to give weightage is as follows:
- We make the window’s infinite, and
- We weight each datapoint according the density where, is the datapoint in the training set, is the new datapoint whose label we want, is the norm, and is the temperature term to control the spread of the density (for high value of the density will approach Uniform, and for low values it will approach Dirac delta).
(Alternative) Dot-product formulation of kNN
We need not limit ourselves to norms, and can use other measures of similarity such as inner products (which can be easily defined over the vector spaces that we are using).
In the kNN algorithm, we calculate the distance metrics and take the neighbor according to the minimum distances. Alternatively, we can calculate the inner product between the new datapoint and the datapoints in the dataset. This gives us a notion of similarity between the new datapoint and each datapoint in the training set. We can then select the most similar datapoints from the training set, and thus giving us the neighbors.
The interesting thing about this formulation is that the value of similarity not only gives us the neighbors, but also the weightage of the datapoints and therefore this weightage can be normalized and used for calculating the contribution of the datapoint towards generating the labels of the new datapoints.
Let the similarity of with the datapoint is . We can calculate weightage as
Additional Topics
Kernel Density Estimation
TODO
KD Trees
TODO